
After you took a photo you can see the result on your camera’s screen. A DSLR offers you also a lot of information about your picture: camera mode, focus mode, ISO, white balance settings, exposure settings, and a strange graph. The graph is called histogram. We will give you a good idea how to read a histogram in the following article.
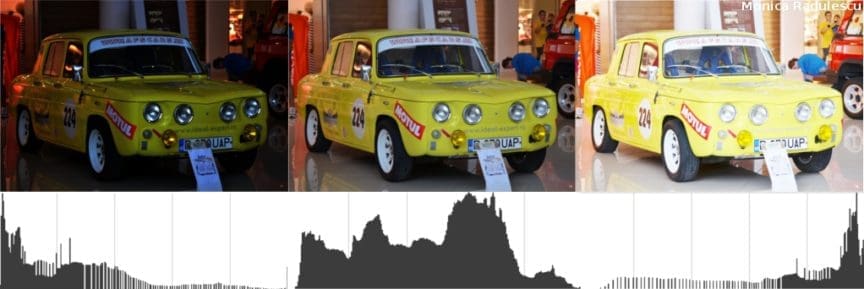
A histogram is a bar graph that represents the frequency of every tonal value from black to white ( 0 – 255 ). This means that on the left you’ll see the amount of dark pixels in your image, the shadows. In the middle, you’ll see the mid tones and on the right, you’ll see the amount of bright pixels (the highlights).
How to read a histogram
There is no such thing as an ideally exposed image, but it is considered that an image with the best exposure has a histogram with high values in the middle and small values on the sides. This means that most of the pixels are in the mid tones and only a few of the image’s pixels are shadows and highlights. The histogram should also be symmetrical in order to have an equal amount of bright and dark pixels. So, if you have high values in the left part of the histogram, your picture is usually underexposed. If you have high values in the right part of the histogram, your picture is usually overexposed.
When is the histogram helpful
Understanding the histogram is helpful when you don’t have good conditions to evaluate a photo directly on the camera’s screen. Maybe the screen is damaged or the light changes your perceptions. Maybe the screen is too small or you wear glasses and it’s hard for you to notice the shades. There are a lot of reasons why you should take a look at the histogram when reviewing a photo on your camera.
The histogram is a gift from the digital era and is highly used is post-processing. When you adjust the exposure with an image processing software try to balance the histogram by changing the amount of dark and bright pixels. The Levels function from Adobe Photoshop and Gimp is based on the understanding of the histogram.
Exceptions
In the world of photography, rules are made to be broken. A balanced histogram is not always what you are looking for. Maybe you want a dramatic contrast, with a spike of bright white in your picture. Maybe you are taking photos of a scene covered in snow, sand, or pitch. The histogram will not be balanced. In this instance, if you know how to read it the histogram will assist you on the way to “perfect” photo.